Visuals
Content Library ModuleThe Visuals question type no longer needs a separate Analytics Module, but will still need the Content Library Module to function.
For clients with on-premise and Azure deployments, clients will need access to the Content Library in order for the Visuals question type to function. Please contact [email protected] to request a license for the Content Library Module for your instance of SmartIQ.
The Visual question type allows you to include graphs or charts as part of the SmartIQ form or Dashboards, by referencing a JSON file that defines the settings and configurations to build the visual output.
The JSON file is based on Vega or Vega-Lite and has to be added to the Content Library before the Visual question type can be used. There are a variety of chart or graph examples for Vega and Vega-Lite that can be added to the Content Library and all of them can be used and customized according to your design needs.
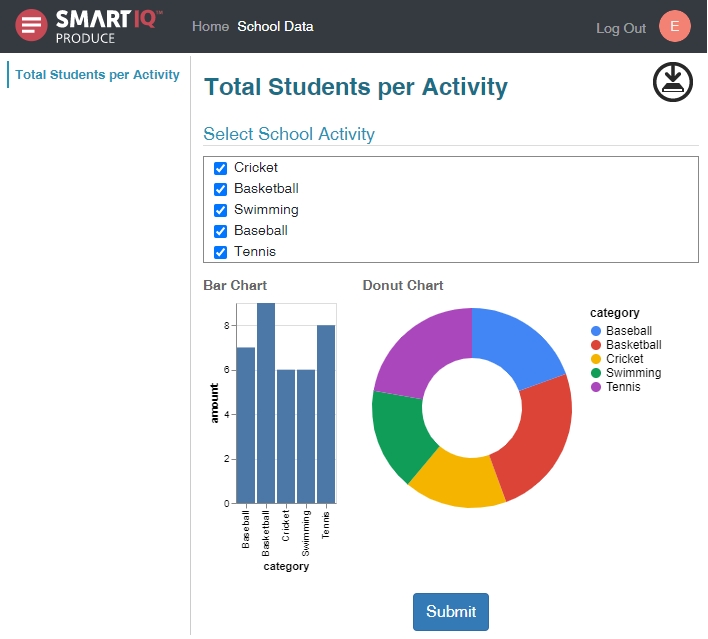
Data connections are referenced by name and can be static or dynamic. In this example, the Bar Chart and Donut Chart both reference the same data connection.
Usage
Adding the JSON File to the Content Library
The Visual question type references a JSON file that defines the settings and configurations to build the visual output and has to be added to the Content Library before the Visual question type can be used.
- Create a new JSON file. Use this sample code for a simple bar chart and name it
barChart.json.
{
  "$schema": "https://vega.github.io/schema/vega-lite/v2.json",
  "data": {
    "values": ##data##
  },
  "mark": "bar",
  "encoding": {
    "x": {"field": "category", "type": "ordinal"},
    "y": {"field": "amount", "type": "quantitative"}
  }
}
Notes
##data##is not valid JSON syntax. This is a keyword used by the Visuals question type that will be replaced with a JSON formatted structure that maps data values.When adding Visual Input in Design, names and input text are case-sensitive.
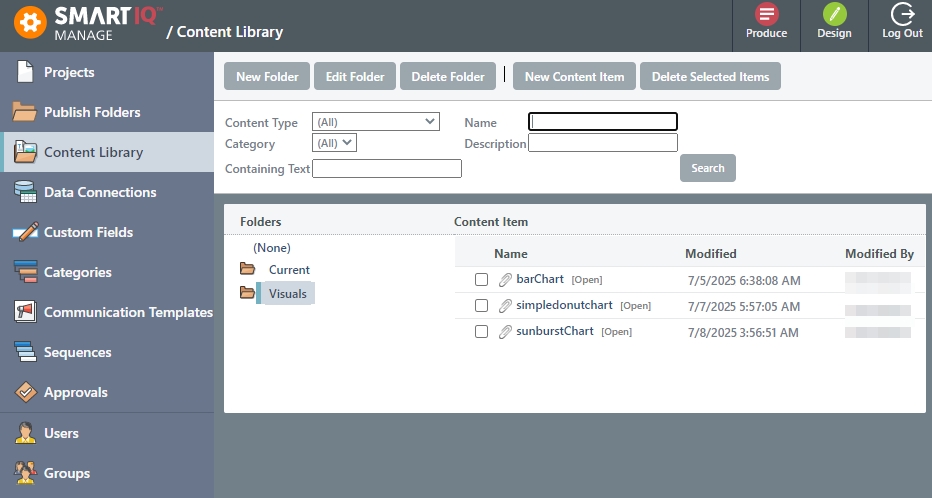
- Create a new folder named Visuals within the SmartIQ Content Library.
- From the Visuals folder, click New Content Item and select Attachment.
- Upload the newly created JSON file and name it
barChart.
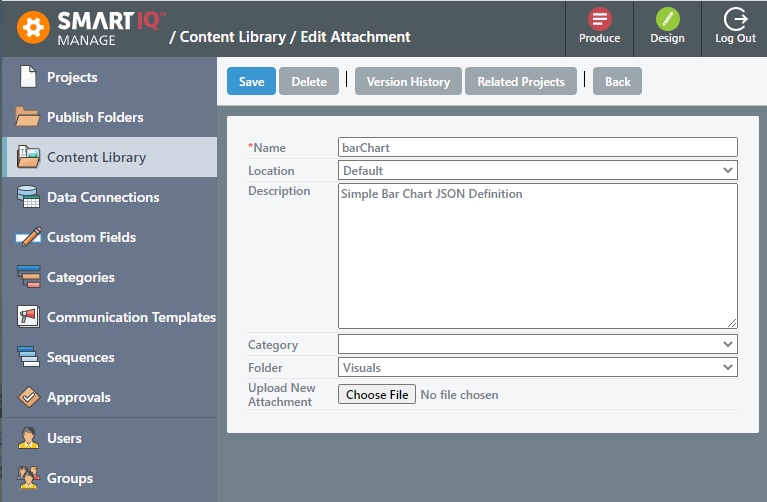
- Click Save.
NoteThere are various types of charts or graphs in Vega Examples or Vega-Lite Examples that can also be added to the Content Library.
Adding the Visuals to the Project
- Create a project with data connections. These data connections will provide the data or values that the visual will use. Depending on your project, these can be data source answers or fragments.
NoteIf the Visual question type does not require interaction from the user, un-check the Visible option.
- Drag and drop the Visuals question type.

- Provide the following inputs:
NoteThe Visual Definition text and name text are case sensitive and should be an exact match to the JSON file.
- Visual Definition – Refers to the name of the JSON file in Content Library that will be used to translate the data into charts, graphs or diagrams.
- Name – Allows adding variables and pipe separated values, making it easier for data coming from a repeating section or a data source, that will be mapped into the visualization definition, replacing the keyword
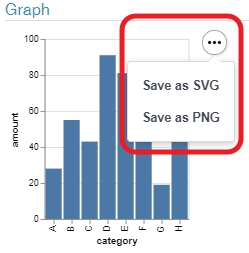
##data##. - Export – If the value is checked, adds an option to save the image as a SVG or PNG file.
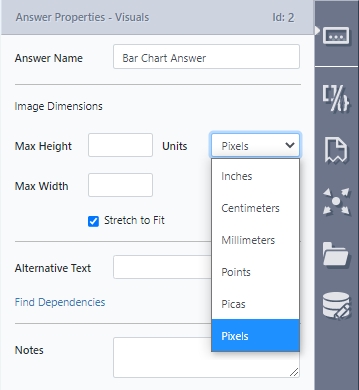
- (Optional) Specify the image dimensions for the output document in the Answer Properties.
- Save the project and view in Produce.
Updated 9 months ago
